Backtest Lab
Strategy backtests and Monte Carlo FX risk, run as reproducible notebooks.
- Year
- 2026
- Role
- Solo — research, modelling, tooling
- Stack
- Python · pandas · Monte Carlo · Backtesting
- Links
- Private work
The problem
Every strategy looks profitable on the chart someone chose to show you. The interesting question is not whether a rule made money once, but how it holds up across parameters, timeframes and market regimes — and that answer only exists if you run the whole grid rather than the one cell that worked. So: eight notebooks, each one a full grid or a full comparison, and every result kept whether or not it flattered the idea.
How it is built
Eight notebooks, in the order they were written, each one answering a question the previous one raised. Daily BTC/USD from 2018 and hourly bars for the intraday work, a scraped OHLCV and market-cap series, and the Fear & Greed index joined on date. Every backtest charges 0.1% per trade and starts from $10,000, because a rule that only wins before costs has not won.
Groundwork — z-scores and RSI on a synthetic series
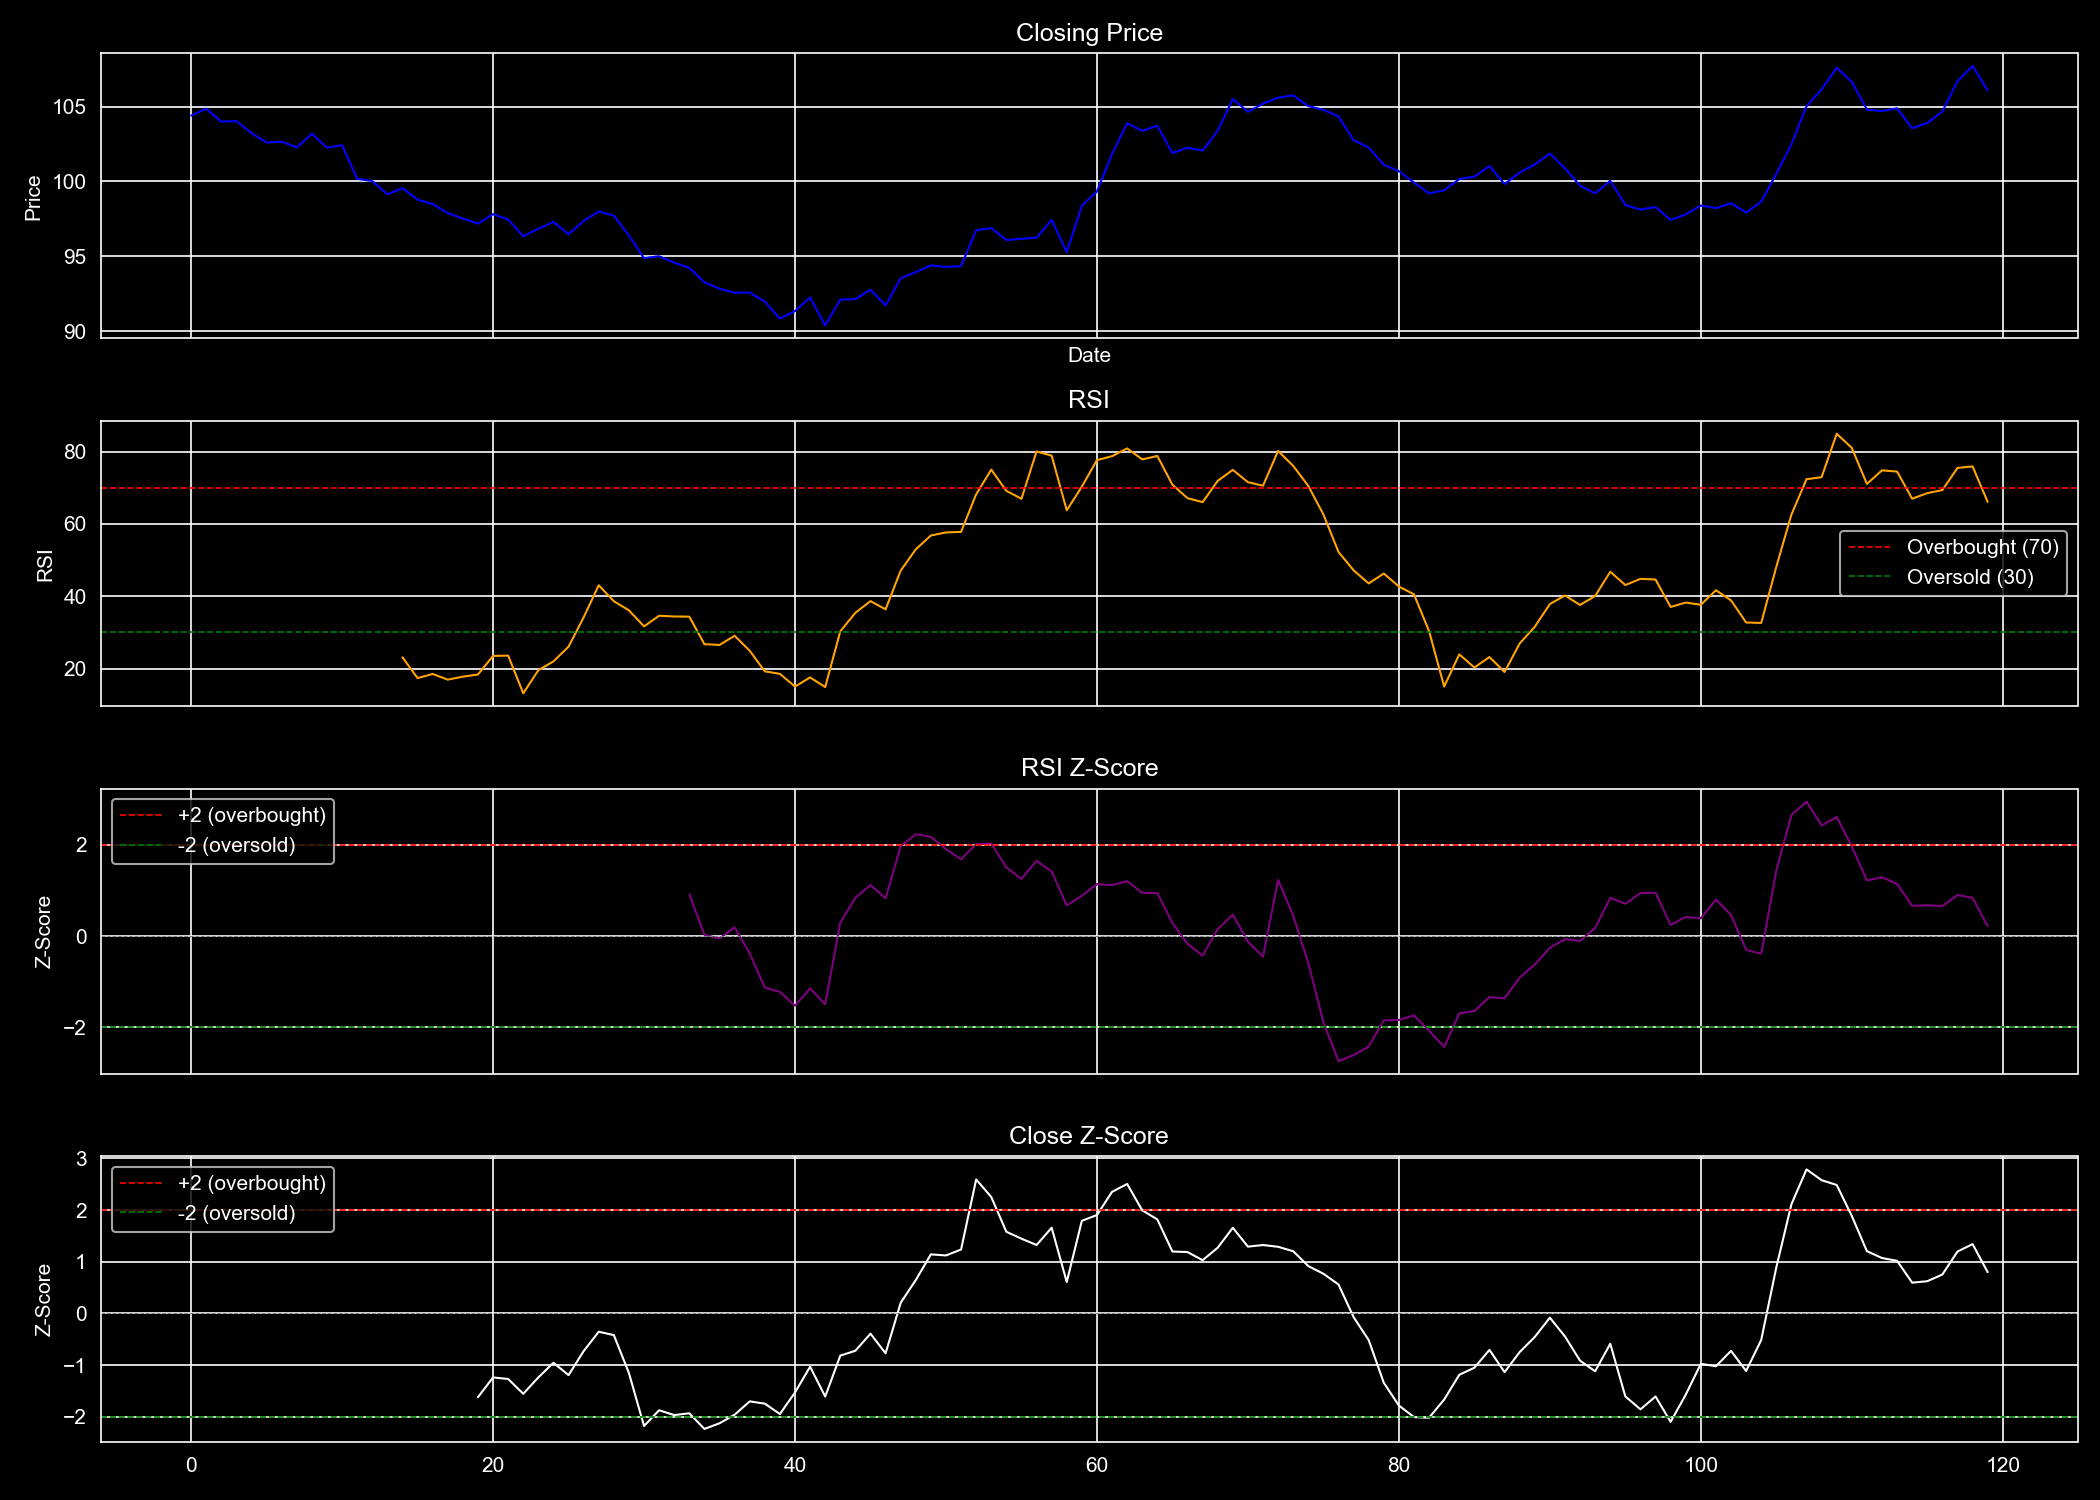
The first notebook, and the only one on synthetic data. Price, RSI, and both of those standardised into z-scores against a rolling window, with ±2 marked. The point was to see how differently the two disagree: RSI reads 70 as overbought at any moment in history, while a z-score asks whether this reading is unusual relative to the last n bars — which is the framing every later notebook uses to decide what counts as a signal rather than as noise.
Simple daily DCA — the baseline everything has to beat
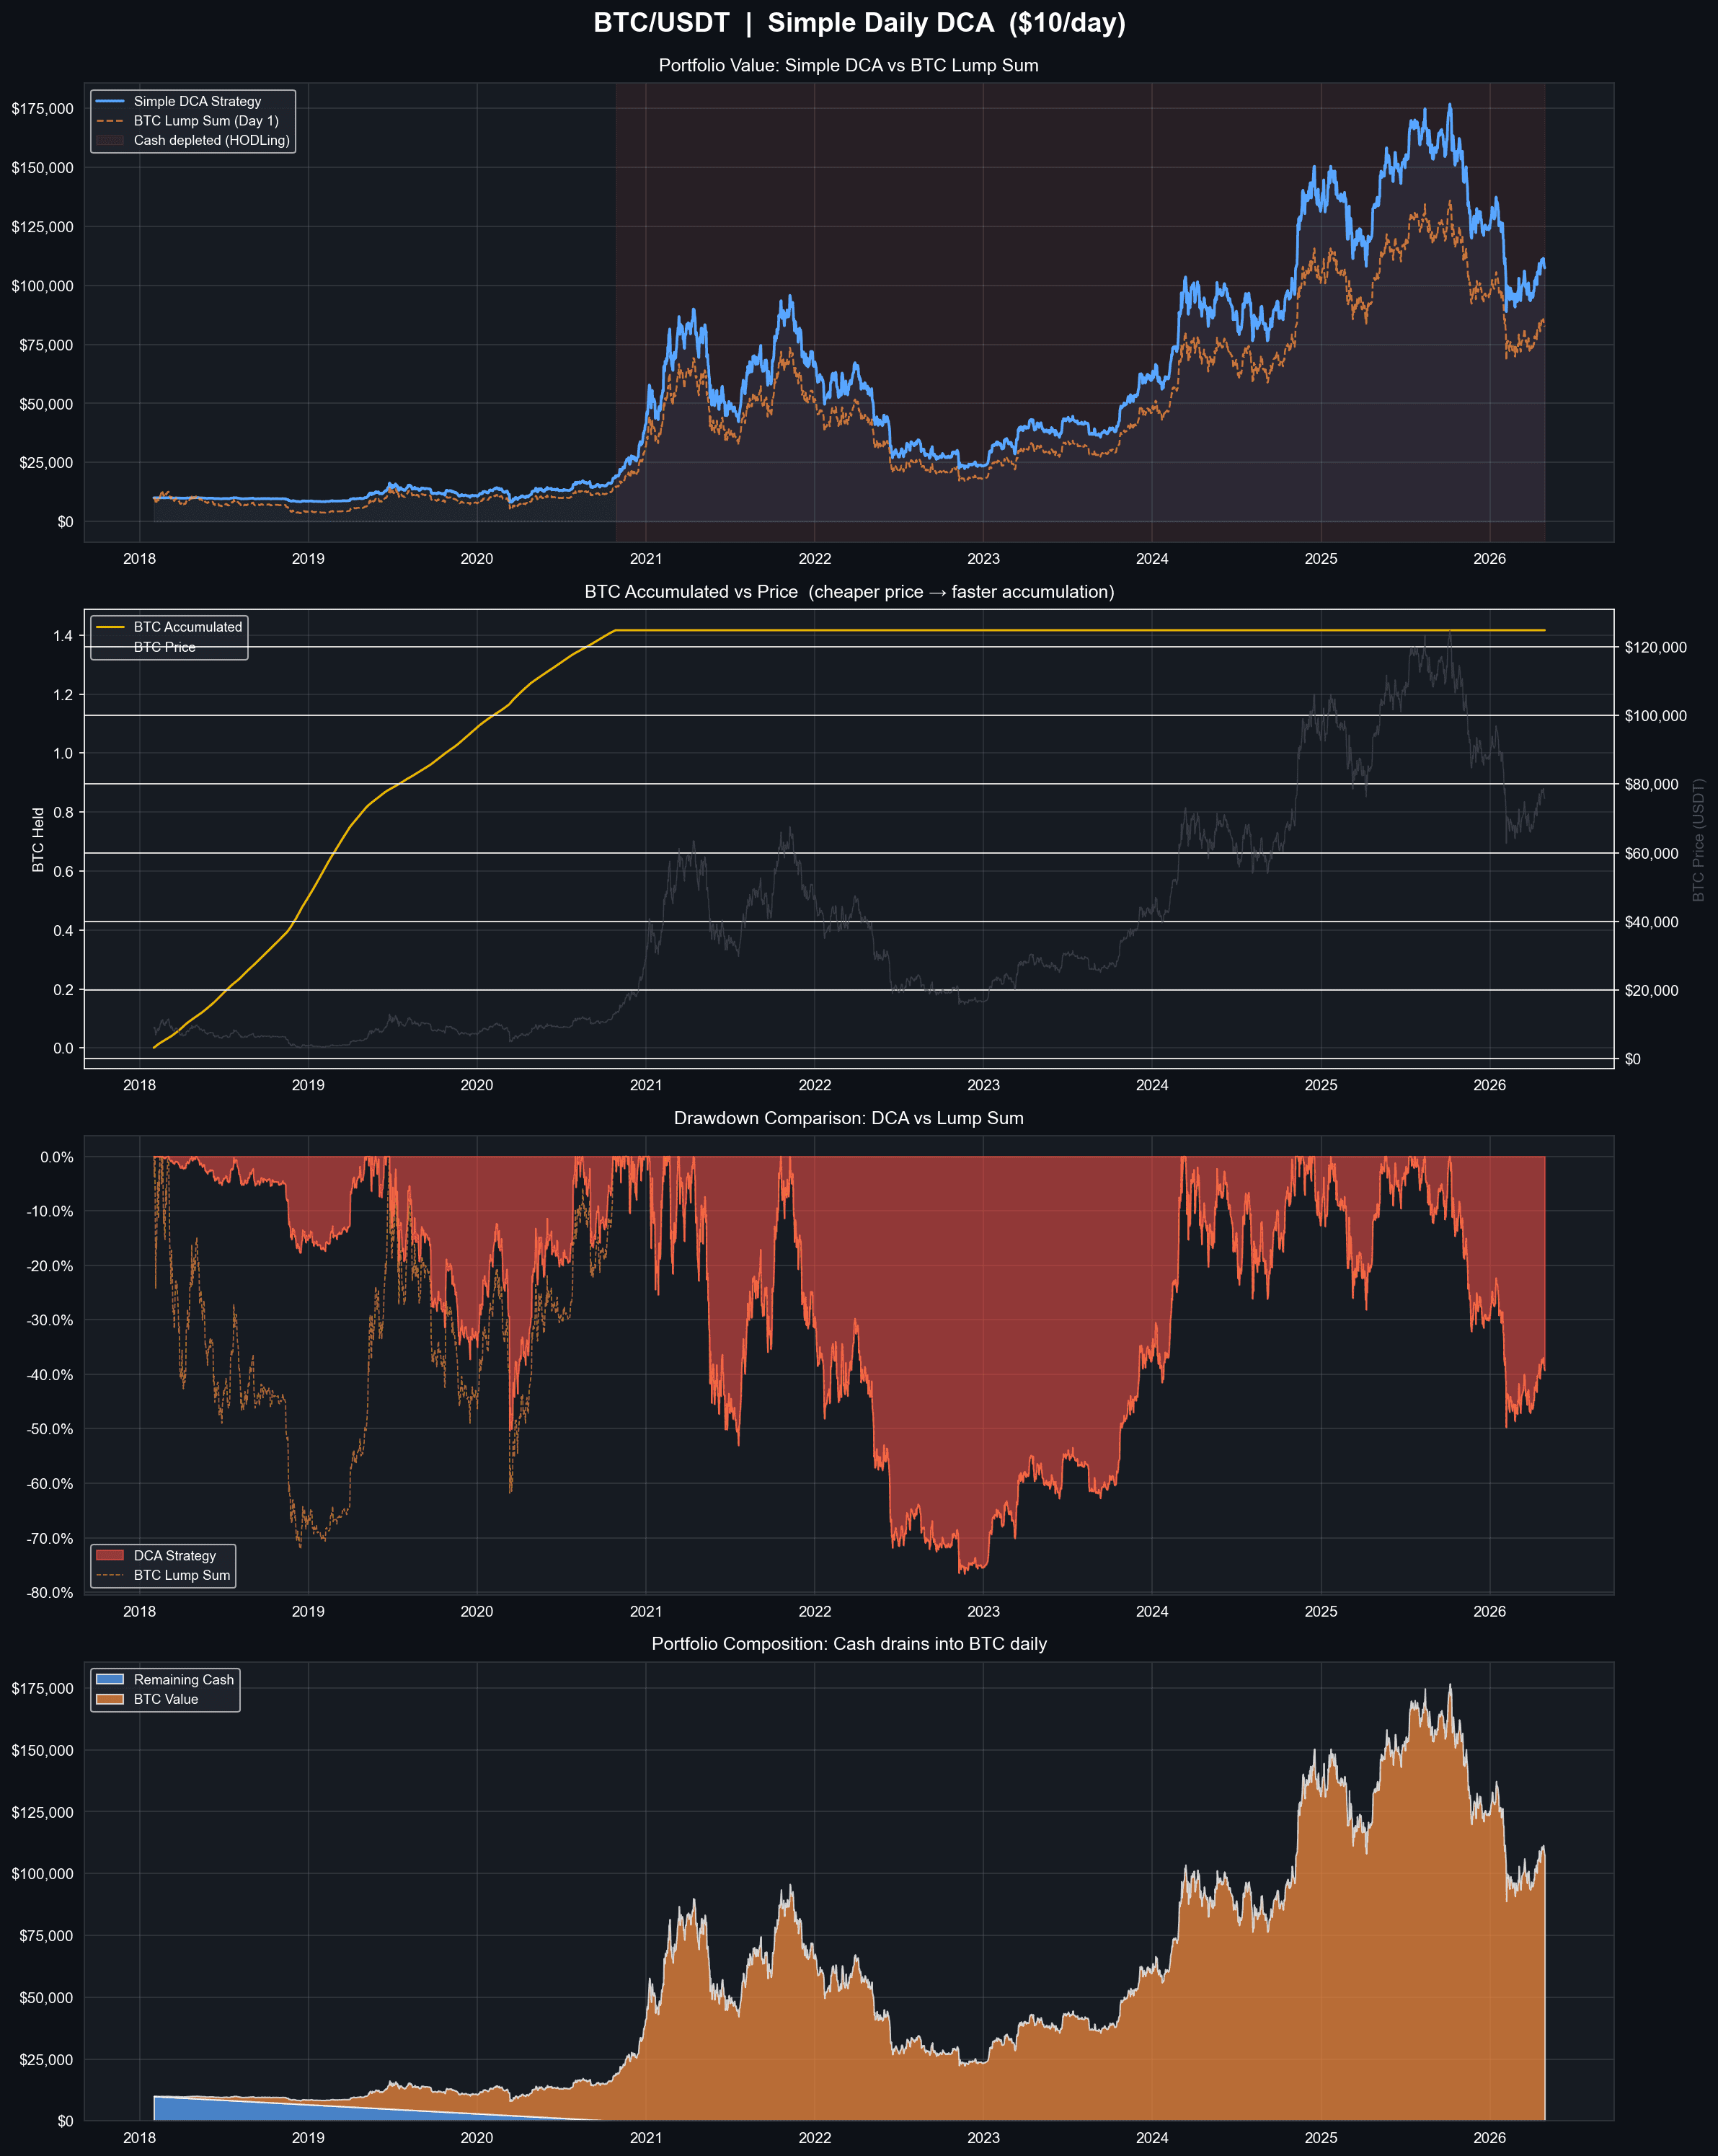
$10 a day, no conditions, no indicators, until the $10,000 is gone after 1,000 days — then hold. It returns 973% against 725% for the same capital dropped in on day one, at an average buy price of $7,059. That is the number every clever strategy in the rest of this project is measured against, and it is not a soft target: buying on a schedule beat lump-sum by 250 percentage points while spending most of its life underwater, with a 76.6% maximum drawdown lasting 846 days.
Fear & Greed DCA — sizing the buy from sentiment
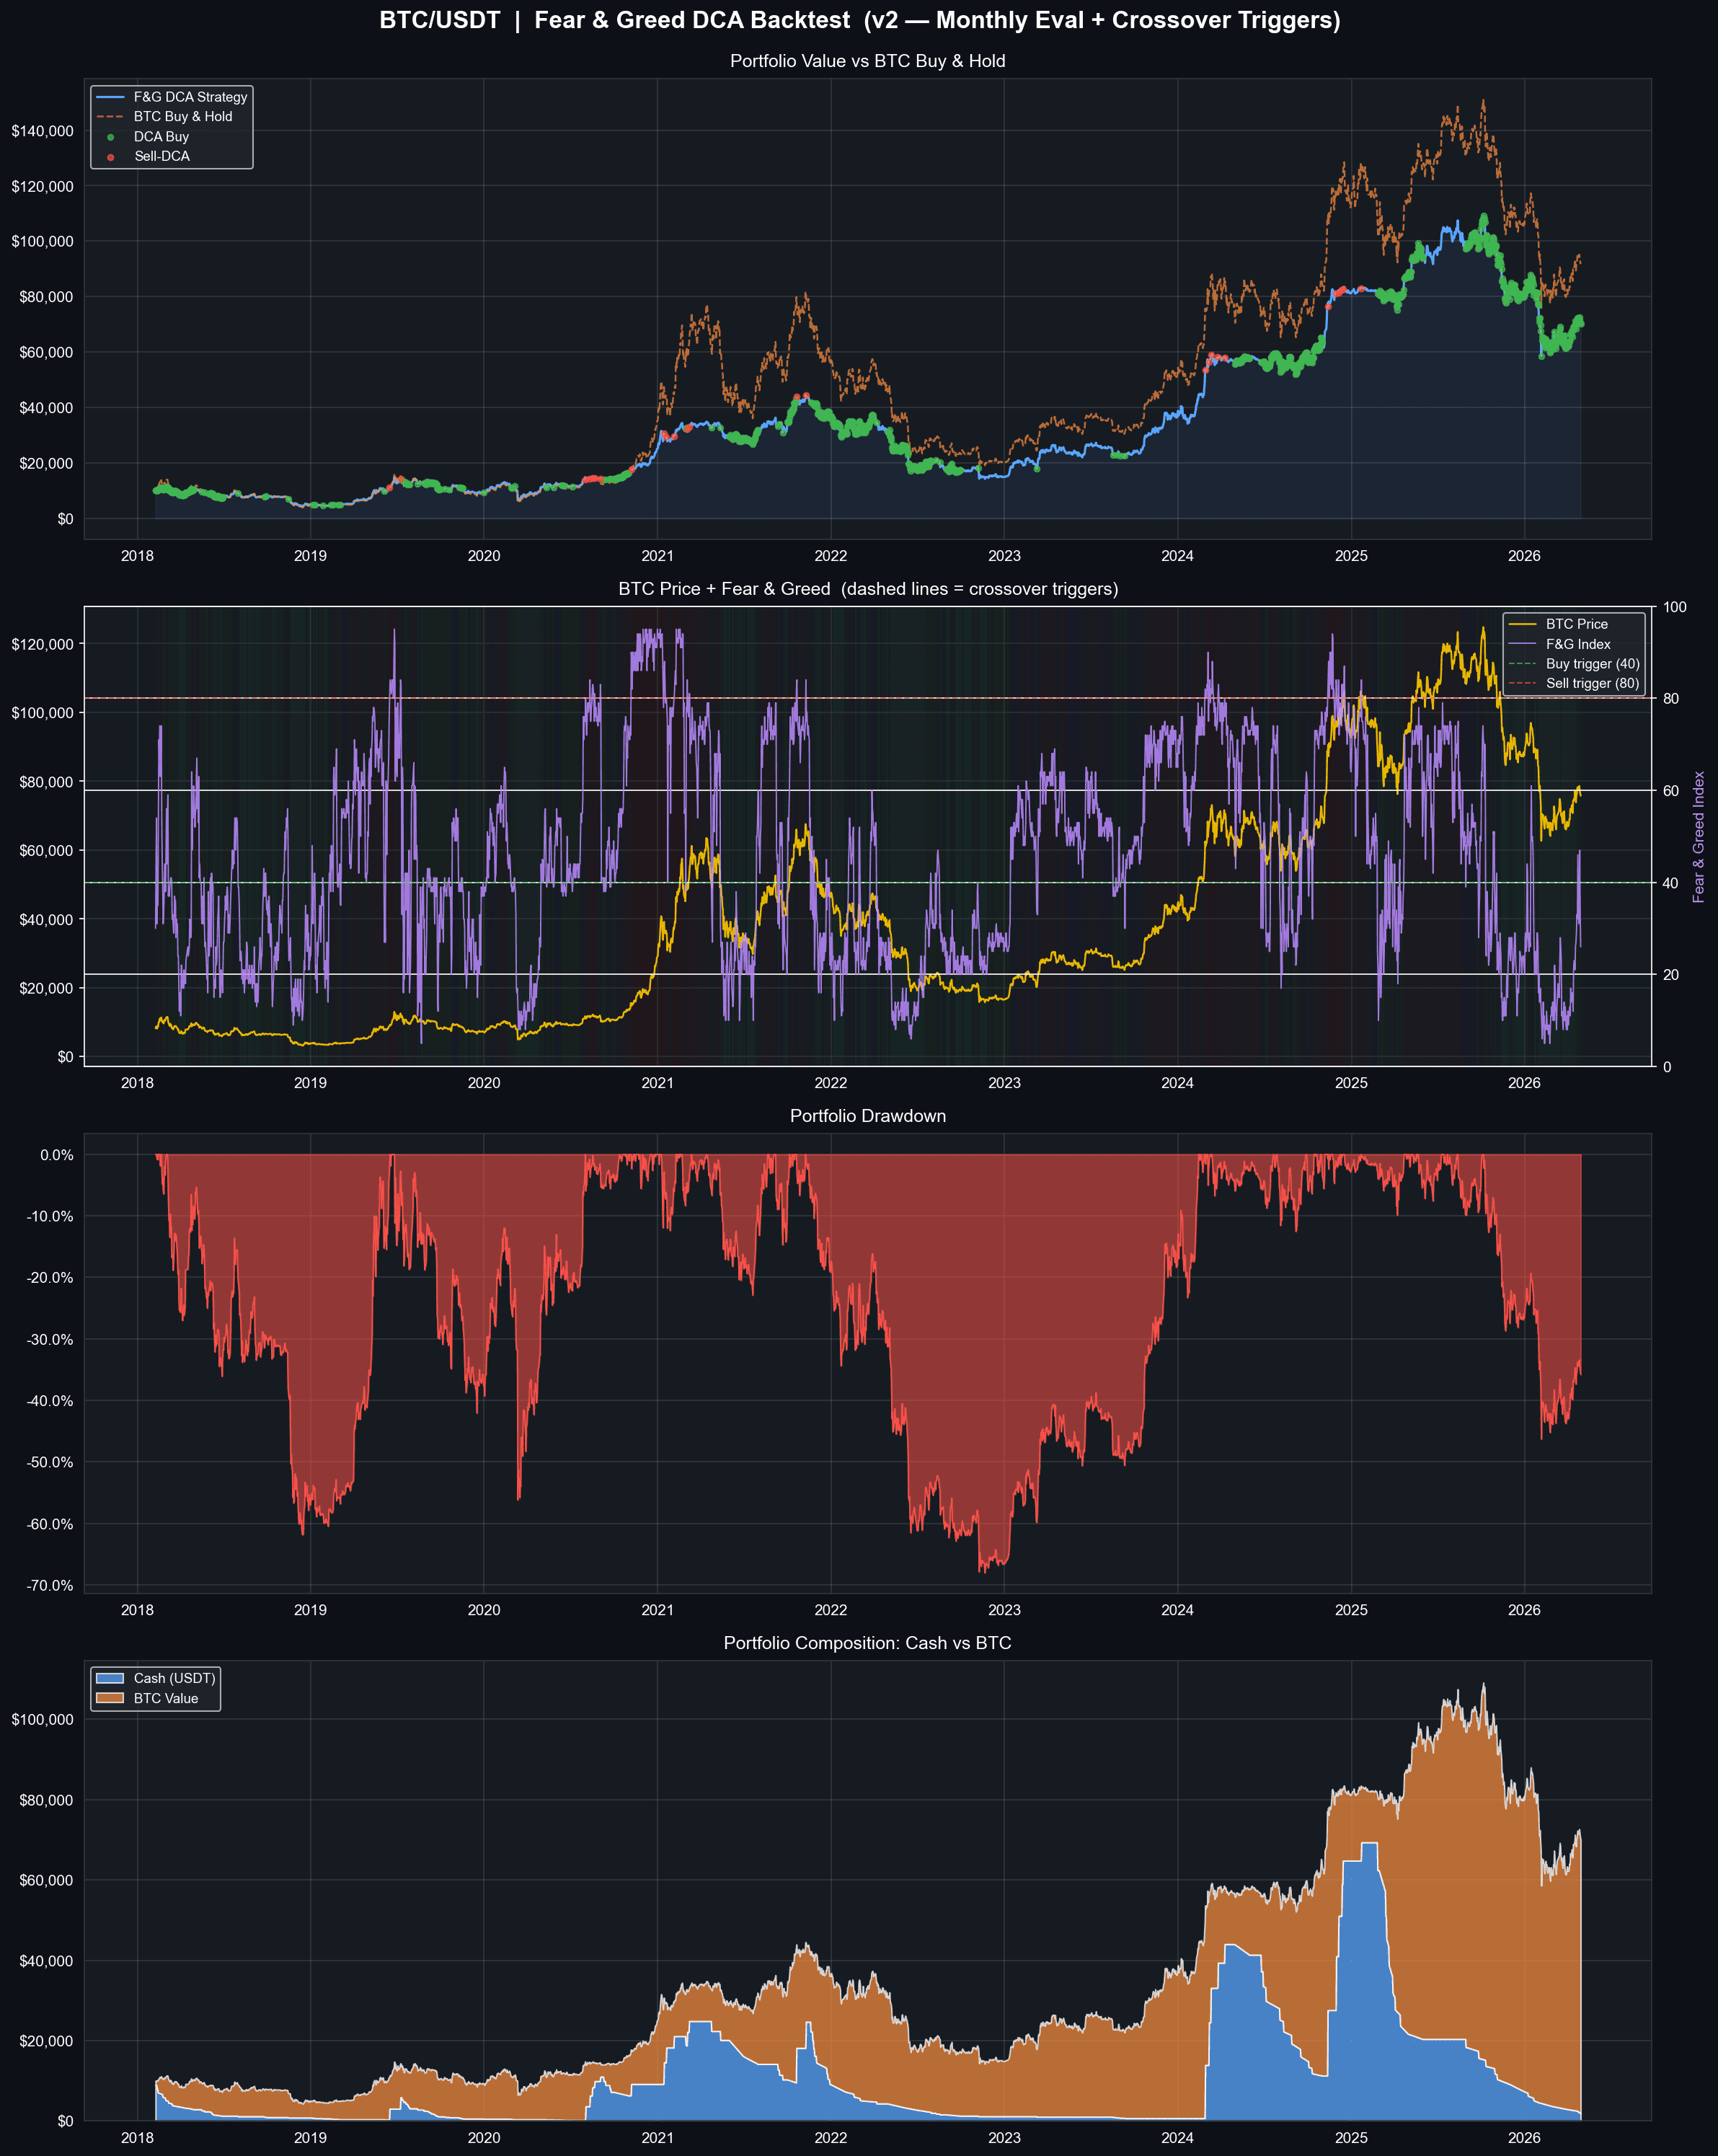
The first attempt to be clever, and the one that failed. On the first trading day of each month the Fear & Greed index sets that month's budget — 20% of cash in extreme fear, nothing at all above 55 — with a one-shot 10% buy whenever the index crosses below 40 and a 25% trim when it crosses above 80. It returned 600% against buy-and-hold's 817%, and the bottom panel shows why: the rule holds a large cash balance through exactly the stretches that ran up hardest, because sustained greed reads as a reason not to buy. Sentiment timed the entries well and the opportunity cost of waiting ate the gain.
Moving-average crossovers — 180 combinations at once
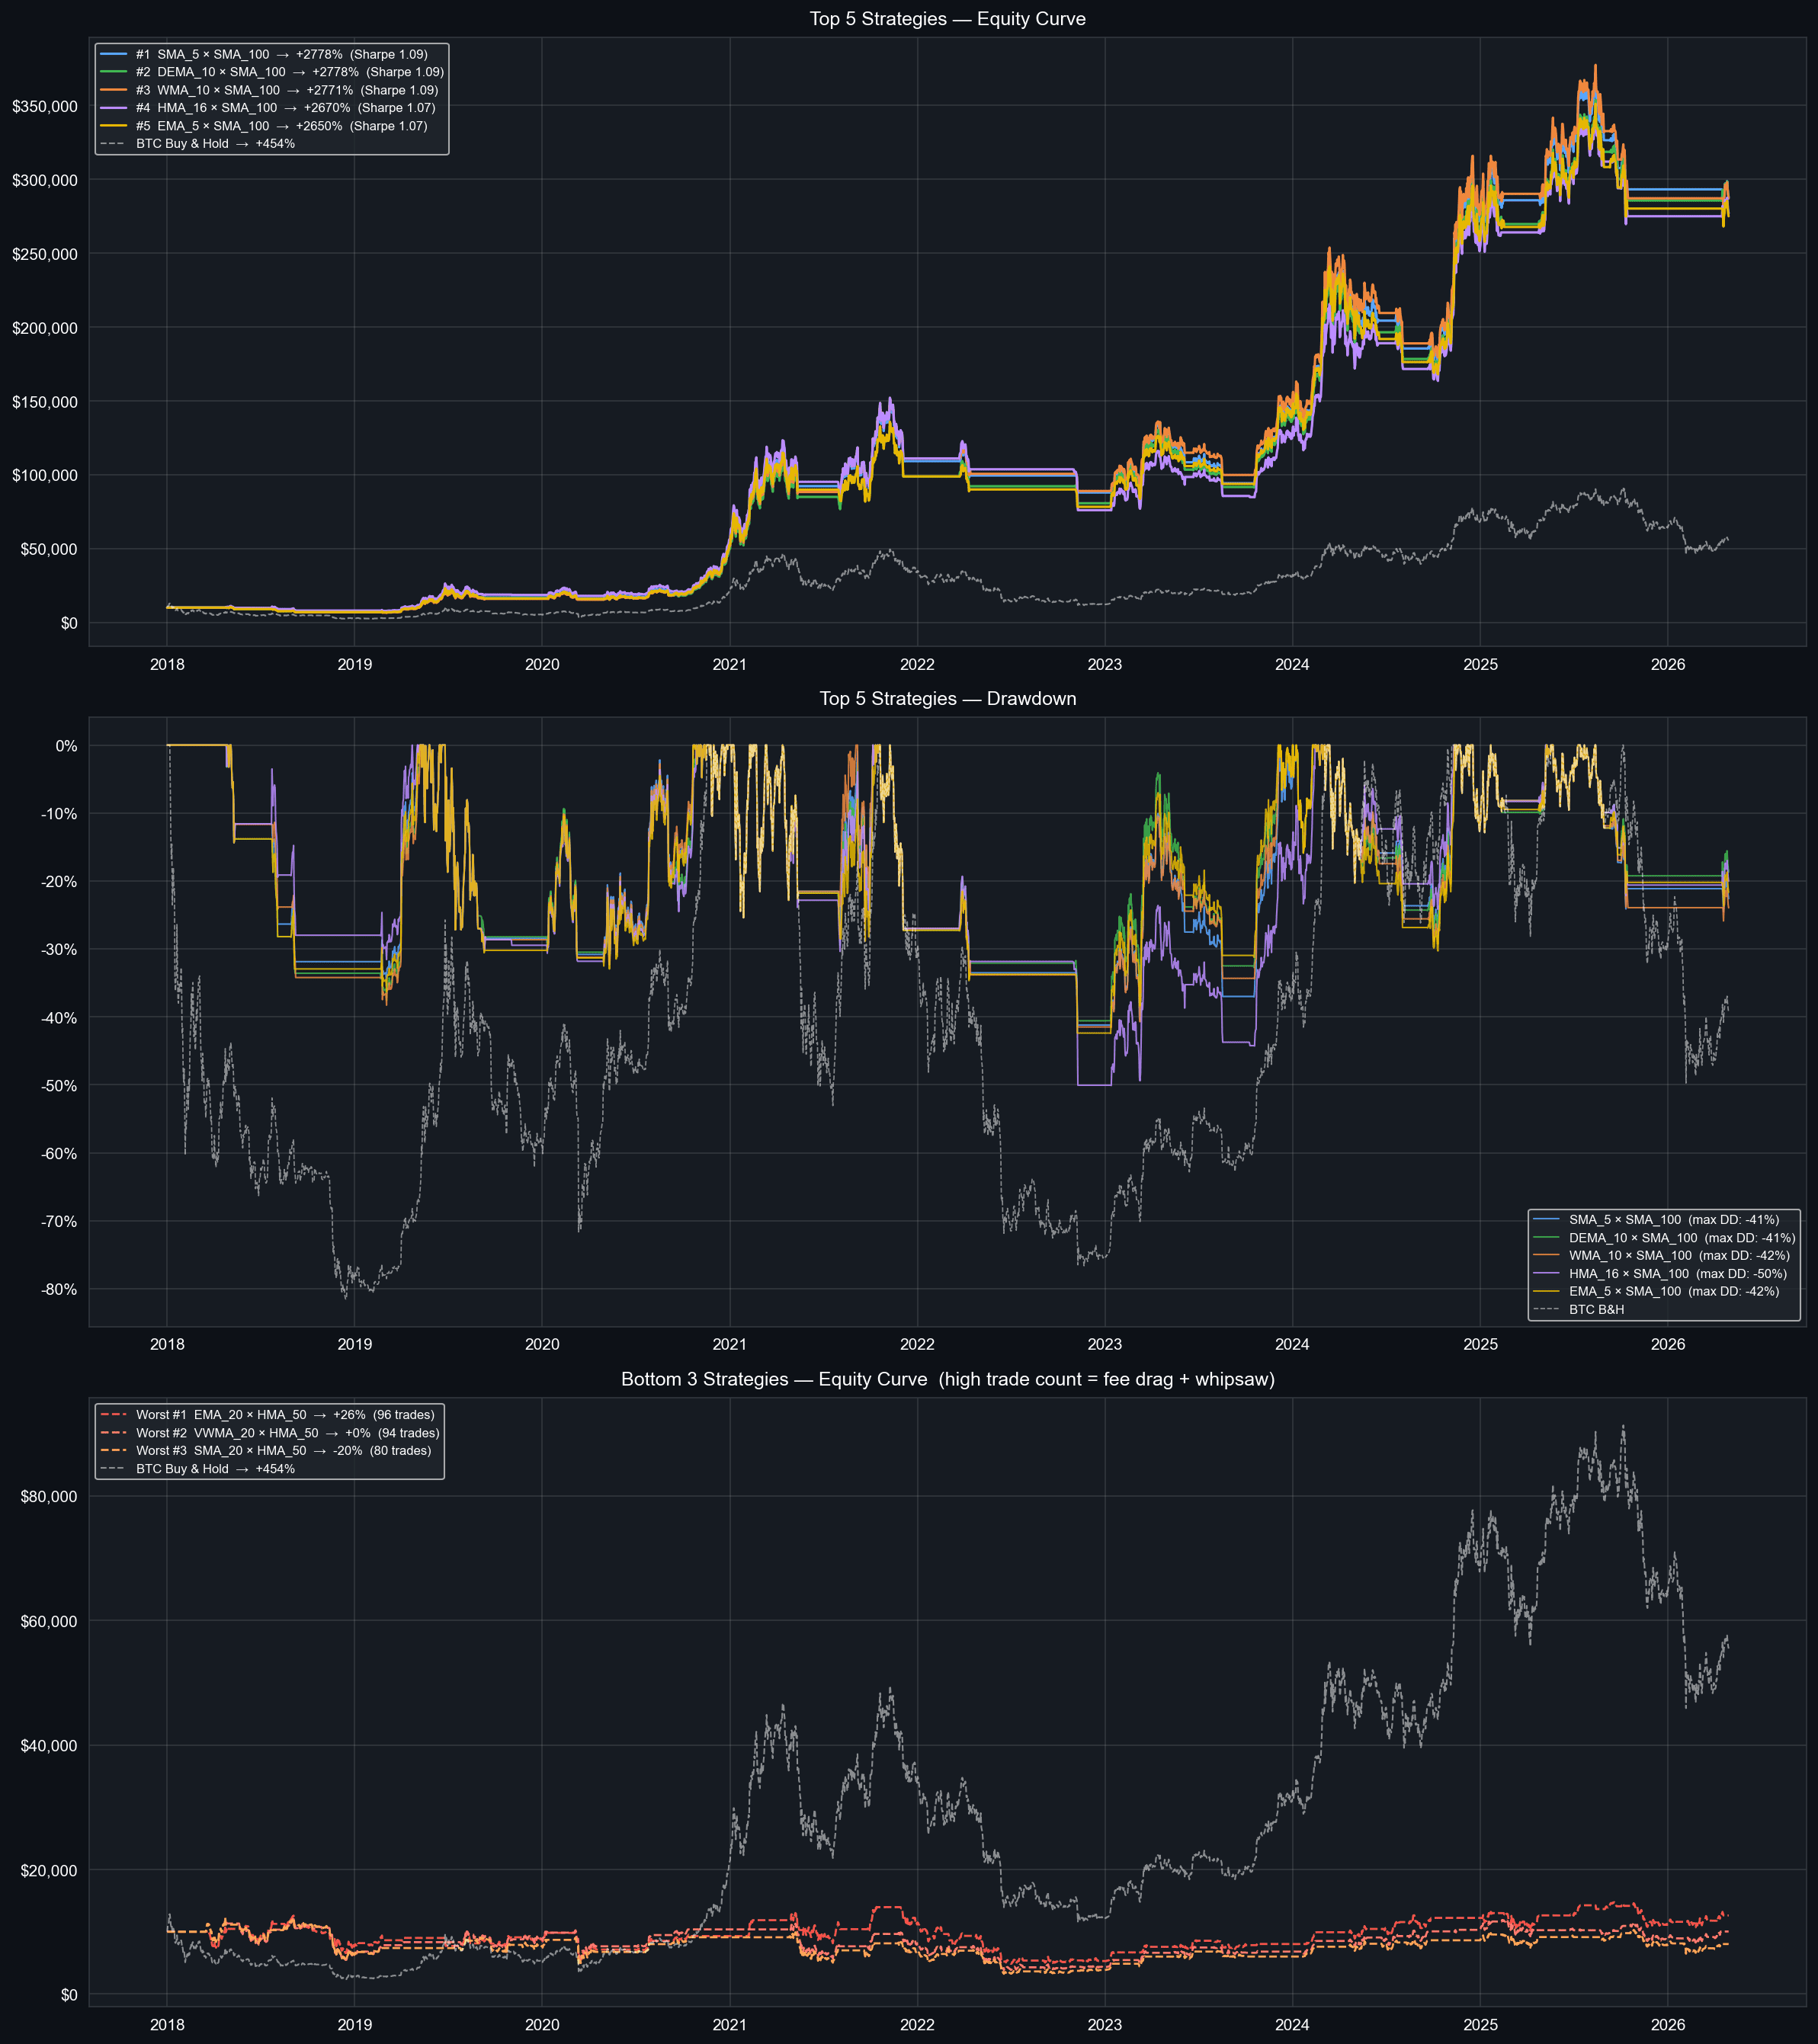
Fifteen fast averages against twelve slow ones — SMA, EMA, WMA, VWMA, Hull, DEMA and TEMA — for 180 backtests over eight years, each running in about two milliseconds. 163 of the 180 beat buy-and-hold's 454%, the best (SMA 5 × SMA 100) returned 2,778% on 43 trades, and the worst lost 20%. The bottom panel is the one worth reading: the losers are not exotic, they are the same idea with more trades, flatlined by fee drag and whipsaw. The middle panel is the real argument for the approach — the winners spend the whole period in shallower drawdowns than holding, topping out near −41% where BTC itself fell 80%.
The same grid, scored on four metrics at once
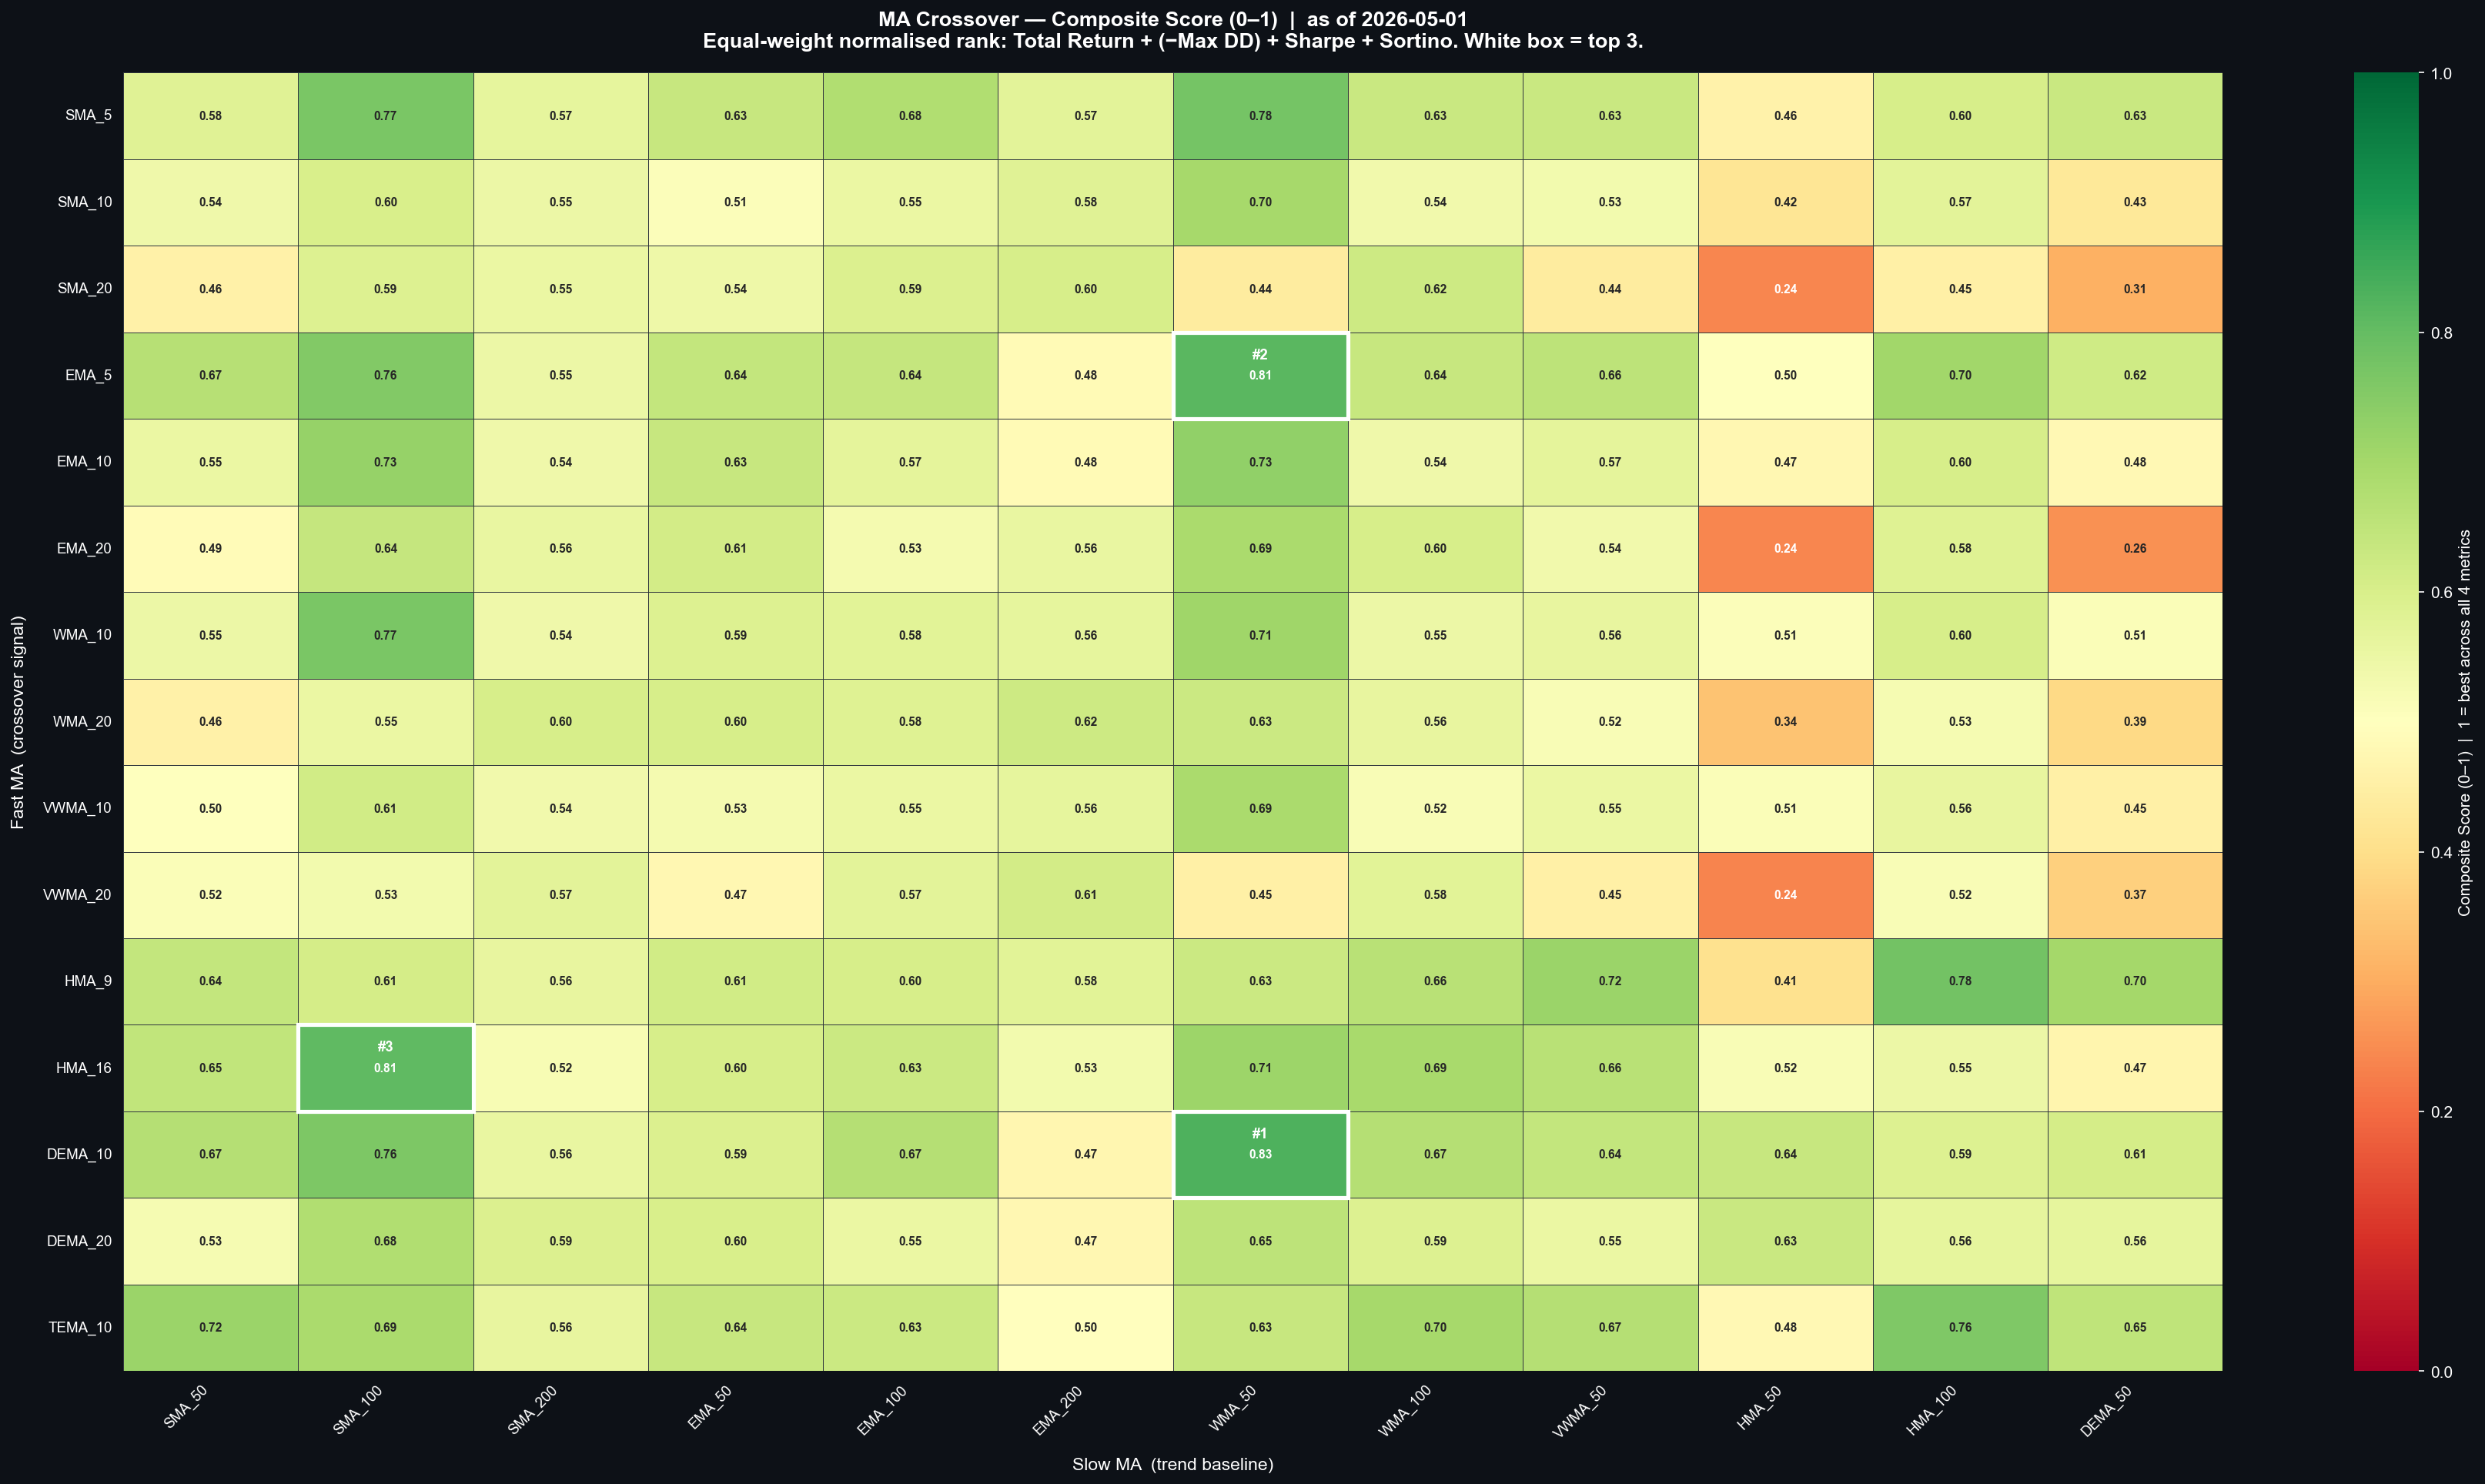
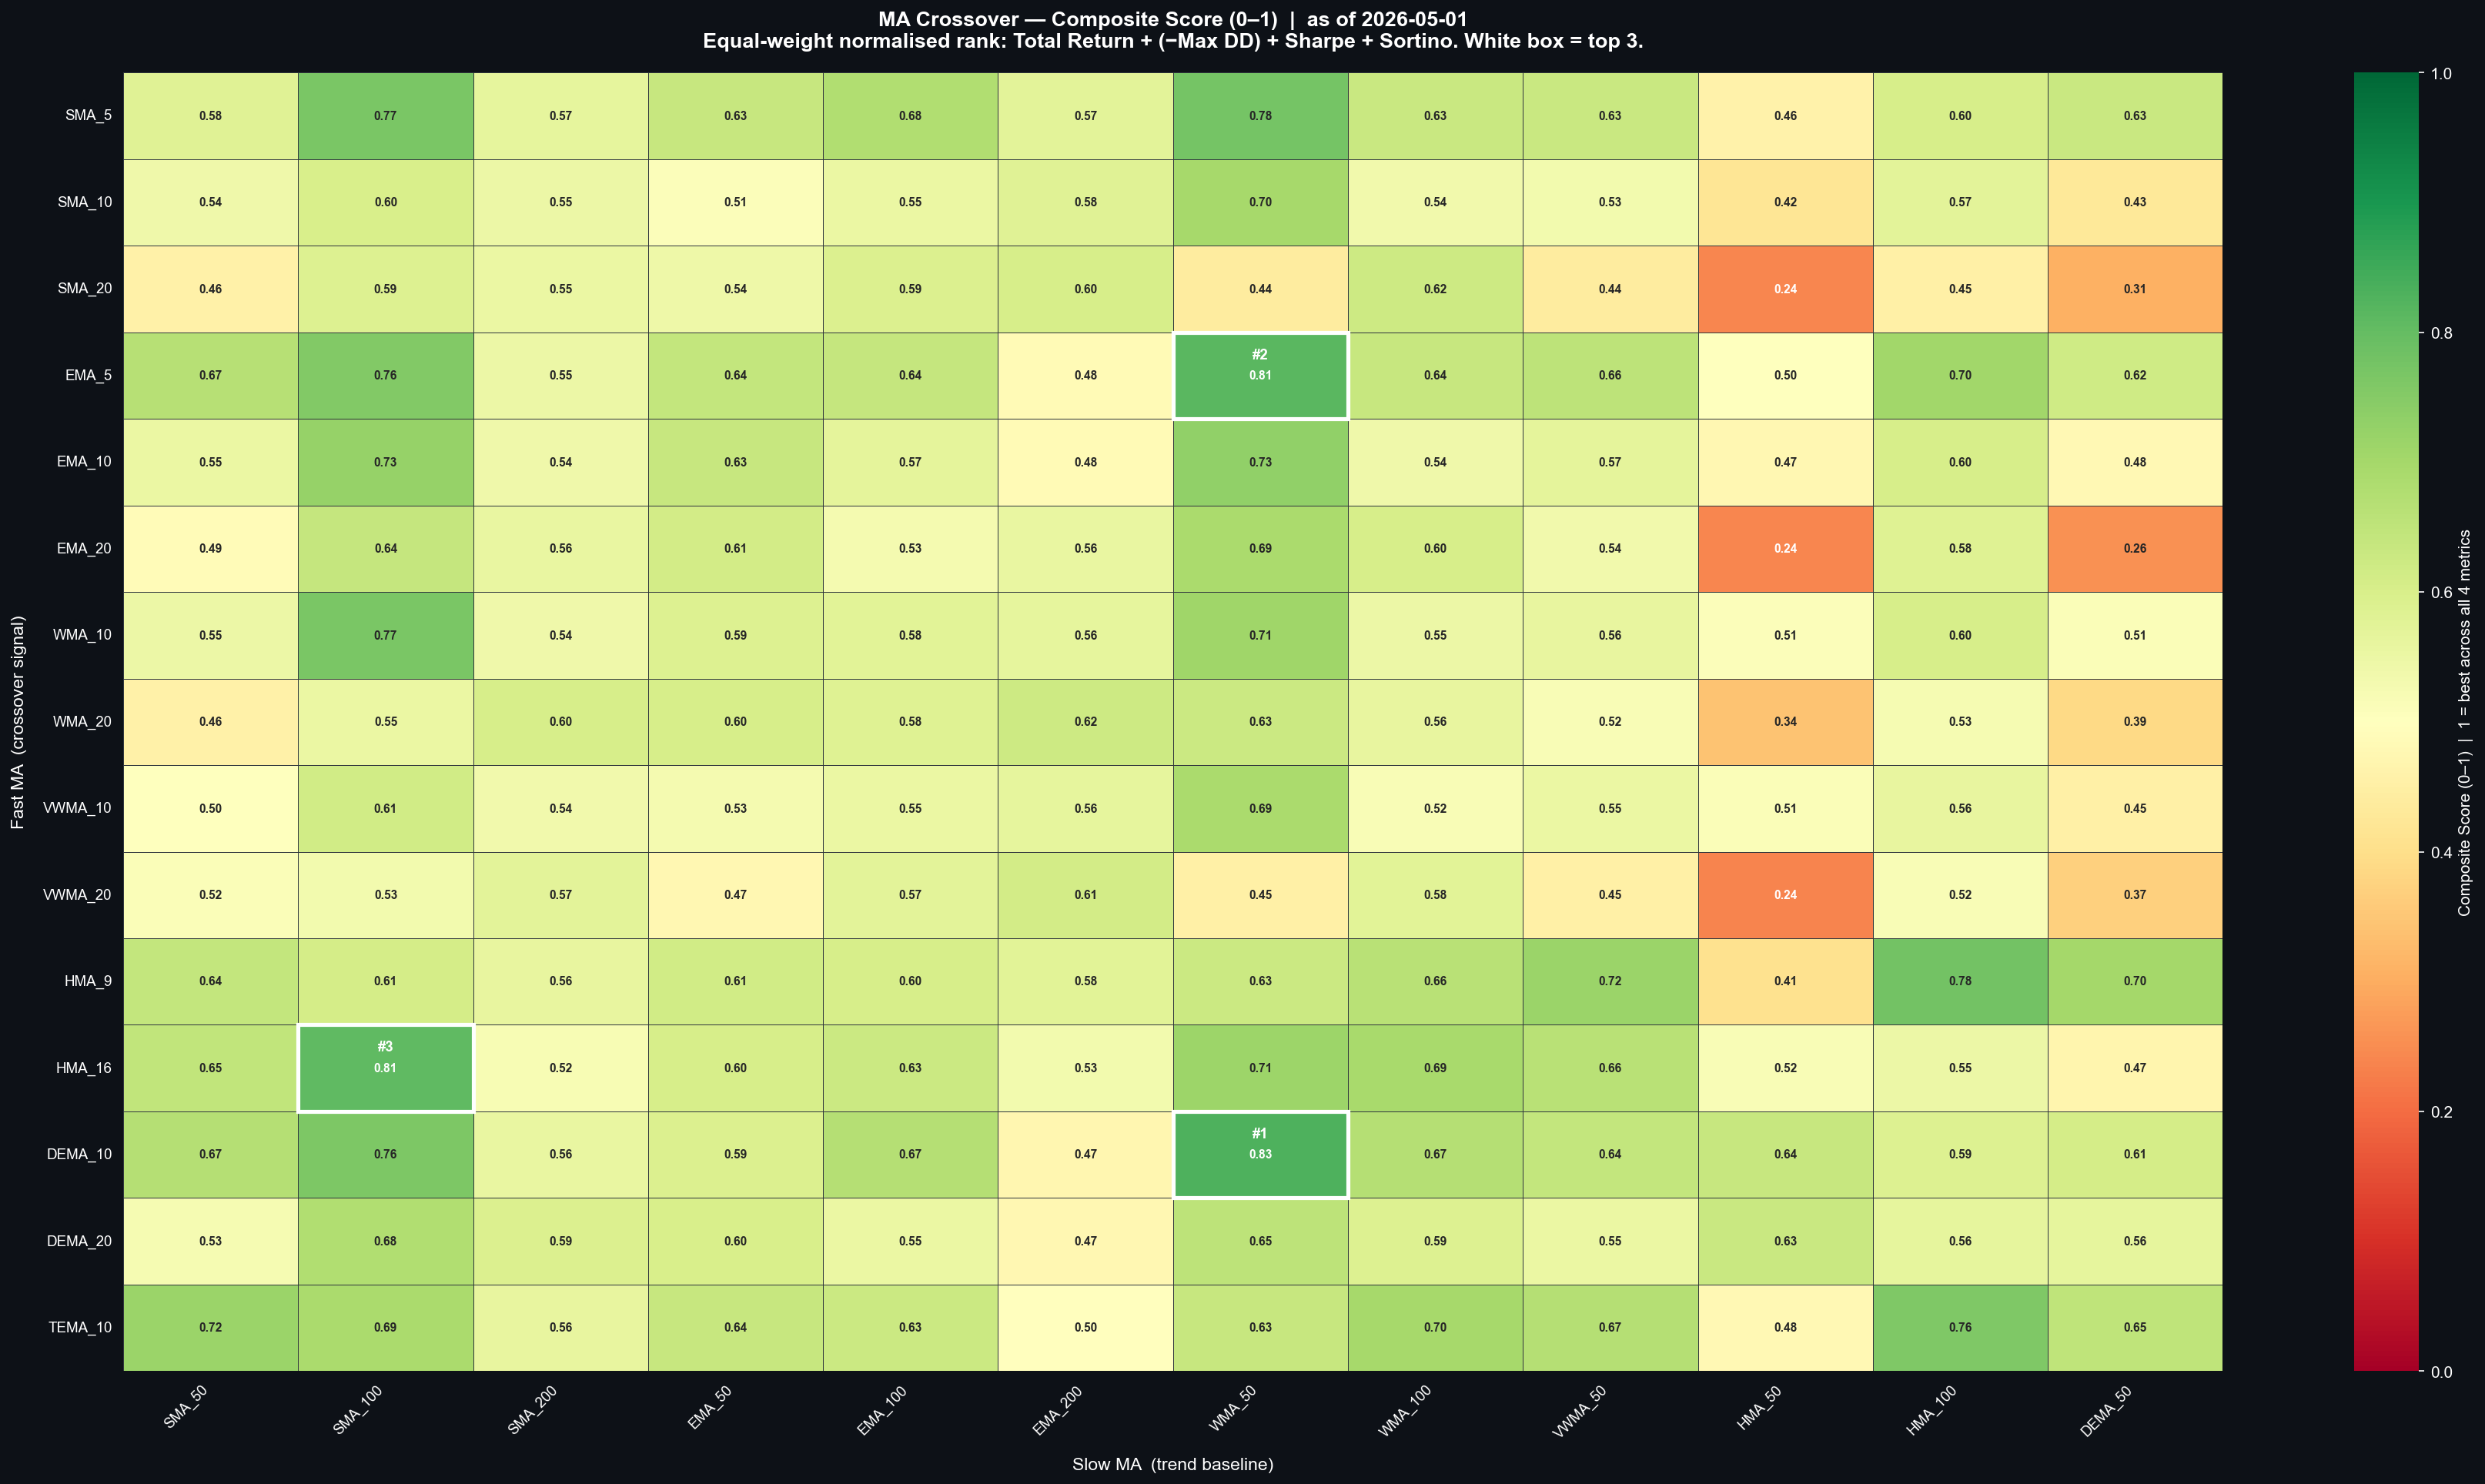
Return alone picks the strategy that took the most risk, so every cell is re-scored as an equal-weight normalised rank of total return, inverted max drawdown, Sharpe and Sortino. The ranking moves: SMA 5 × SMA 100 wins on raw return but DEMA 10 × WMA 50 wins on the composite, and the top three sit at 0.81–0.83 out of a possible 1.0 with a long plateau of near-identical cells around them. That flatness is the finding. Nothing here is a peak worth trusting — pick a different metric and a different cell wins.
Does the timeframe matter? 4H minus 1H
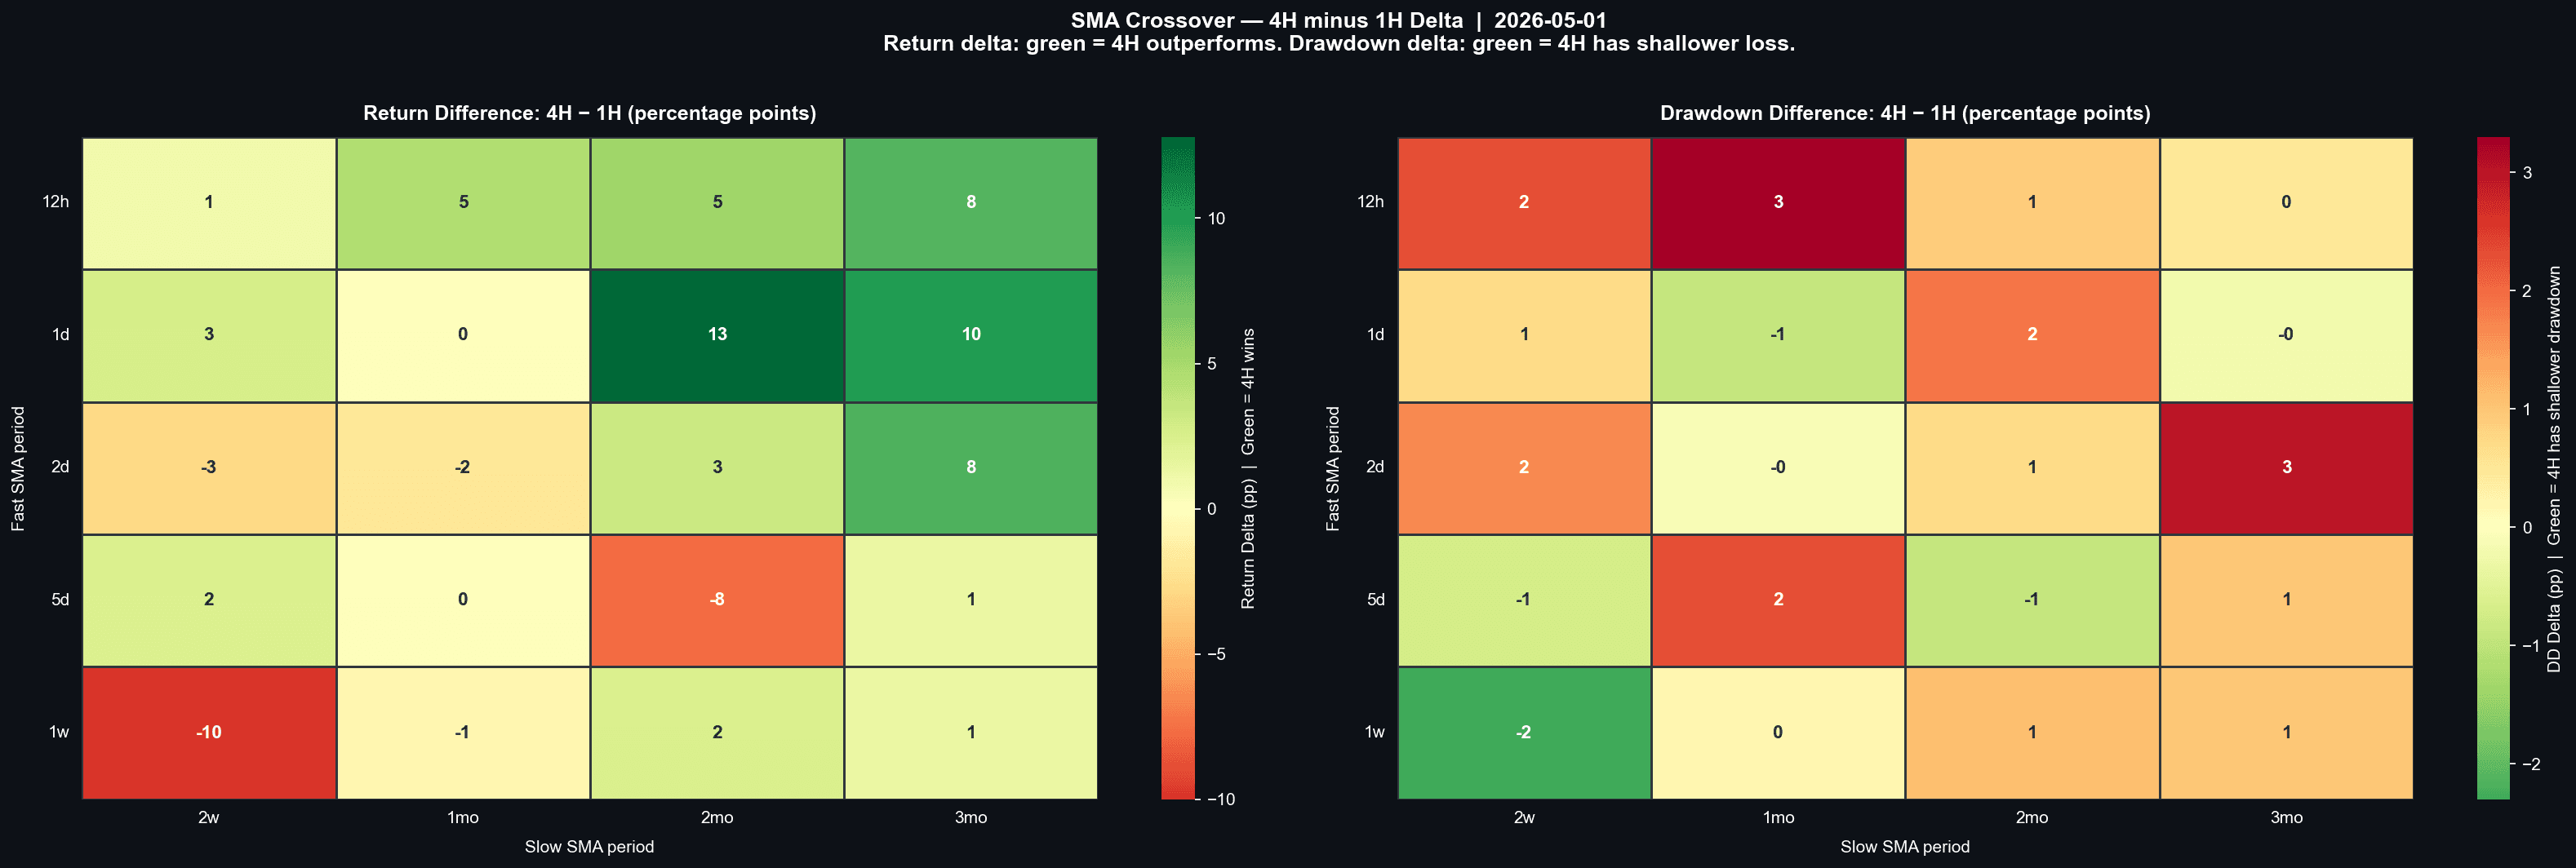
The same SMA rule on hourly and four-hourly bars, with the periods defined in real hours and converted to bar counts, so every cell has an economically identical twin in the other grid. Both timeframes beat buy-and-hold in exactly 9 of 20 cells, and both agree on the best pair — 5-day against 3-month, +64% versus +65%. The deltas here run from −10 to +13 percentage points with no structure to them: adjacent cells swing in opposite directions. On this window the choice of candle is not an edge, it is noise with a plausible story attached.
Two halving cycles — crossover against DCA against holding
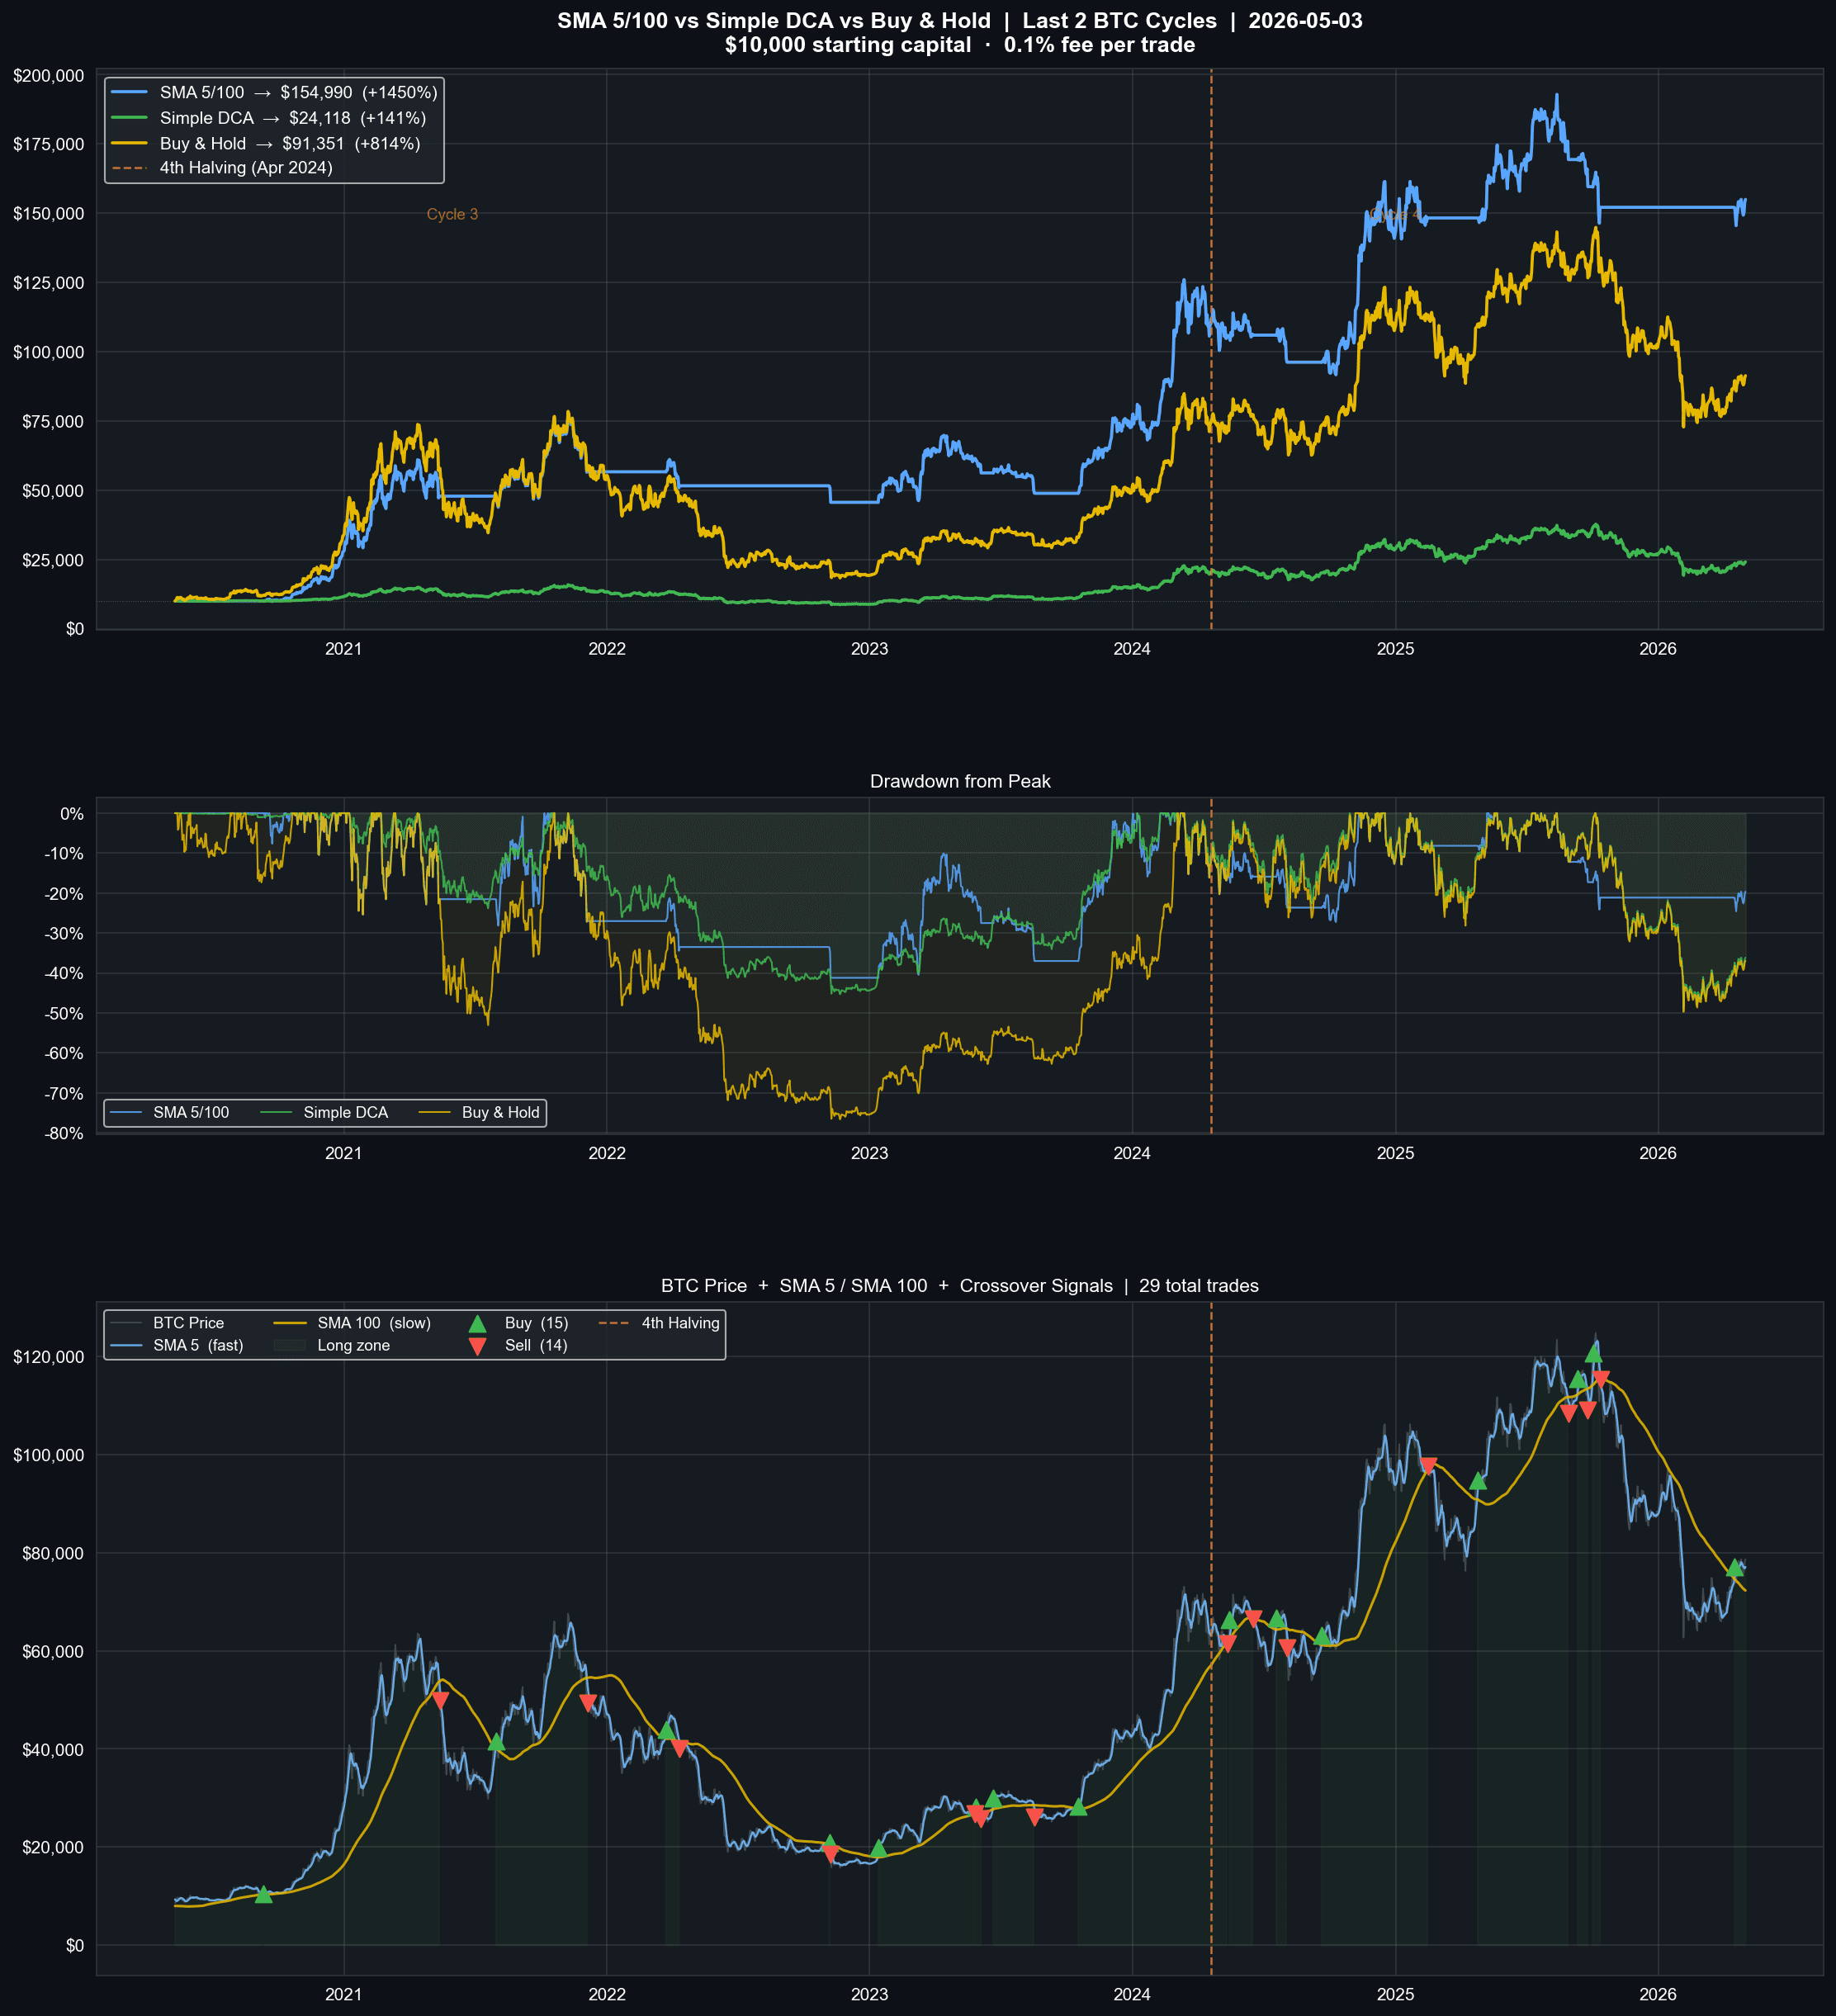
The grid's best rule taken out of the grid and run honestly from the May 2020 halving, against daily DCA and against holding, on the same $10,000. SMA 5/100 finishes at $154,990 to buy-and-hold's $91,351 and DCA's $24,118 — and it does it in 29 trades with a −41% worst drawdown where holding took −77%. Splitting at the April 2024 halving is what stops this from being a victory lap: cycle 3 returned 995% and cycle 4 returned 41%. The rule still won in the second cycle, by 18 points against holding, but a strategy validated on a 2020 bull run and deployed in 2024 would have earned a fraction of what its backtest promised.
Monte Carlo USD/IDR — five-year FX risk band
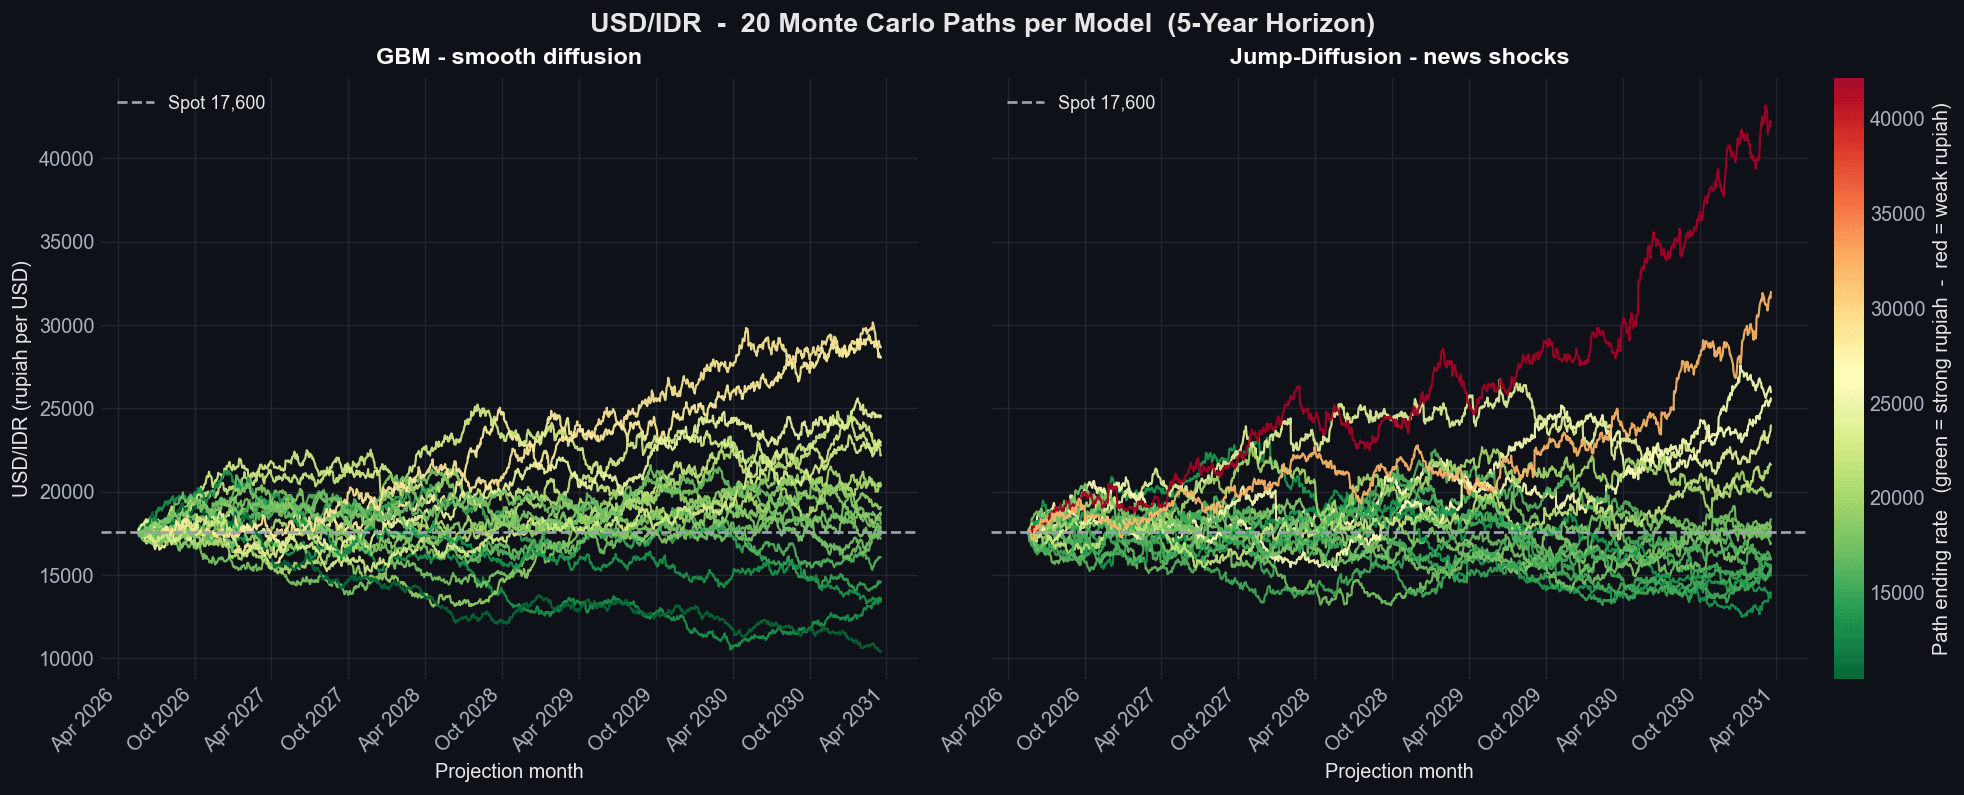
A change of subject, and the most recent work: not a trading rule but a planning tool, written as a briefing for a CFO carrying rupiah exposure. Twenty paths per model from a spot of 17,600, with 10.6% annualised volatility measured from three years of history. Drift is set by covered interest parity — the 5.75% versus 4.00% policy-rate gap, or +1.67% a year — rather than by extrapolating the recent trend, which would have implied +5.36% and quietly baked a forecast into an assumption. The right panel adds Poisson news shocks at eight a year; the compensator keeps average drift unchanged, so the jumps buy fat tails and not bias.
The number the briefing actually delivers
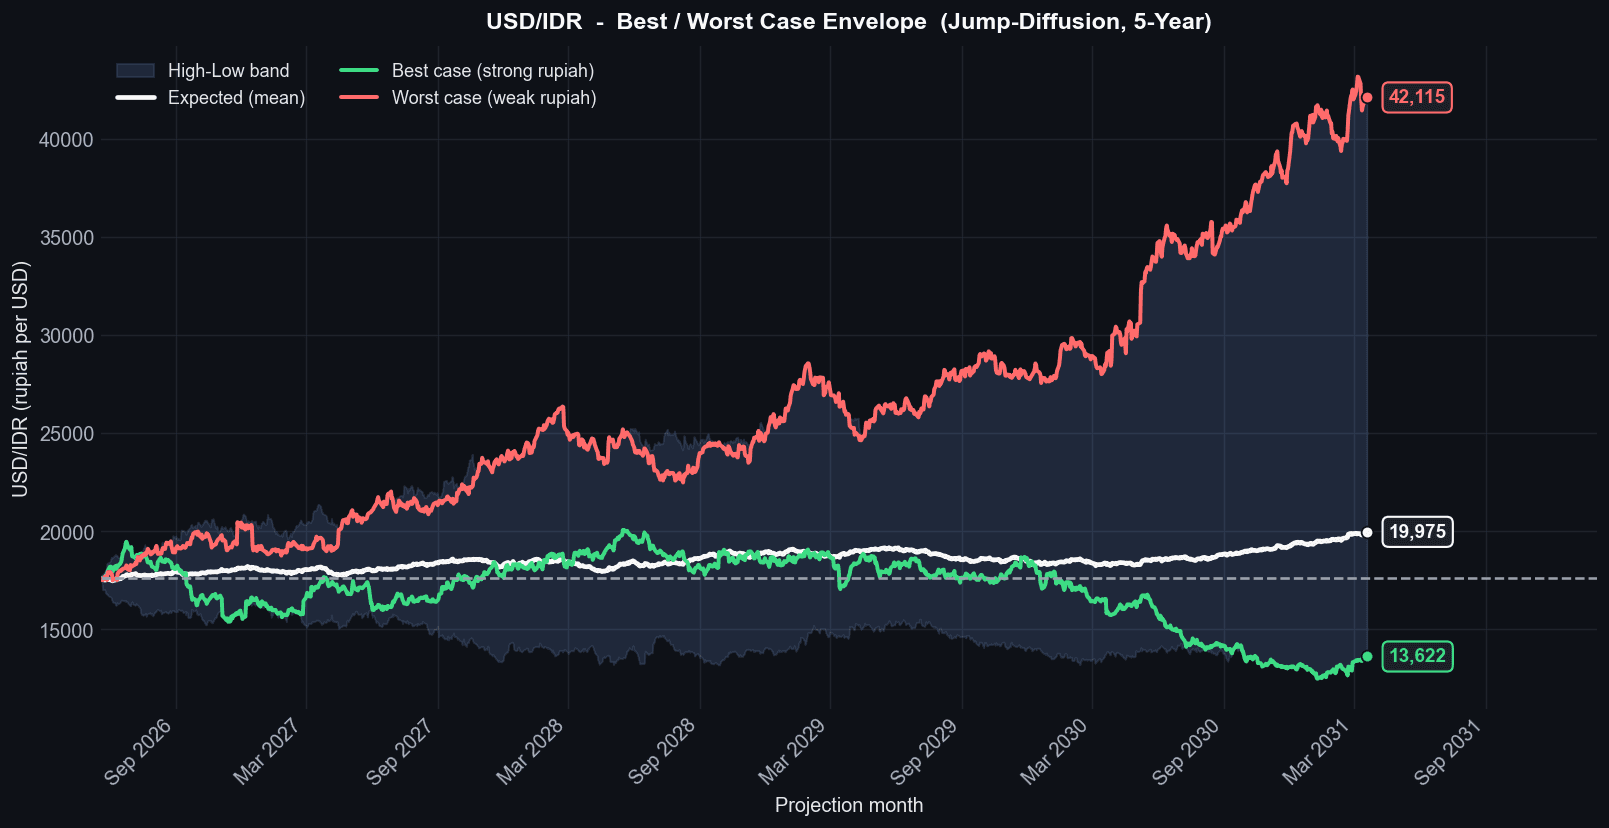
The envelope, and the caveat that matters more. Jump-diffusion centres on 19,975 rupiah by 2031 with a band from 13,622 to 42,115 — 28,493 wide, against 18,211 under plain GBM, which is the cost of admitting that news happens. A rising rate means a weaker rupiah, so the red path is the one to budget against. But the endpoints are the extremes of twenty scenarios, not bounds, and even the jump model assumes constant volatility and no Bank Indonesia intervention. Multi-year FX is close to unforecastable; this is a planning band, and the notebook says so in its own conclusion rather than in a footnote.
What it comes to
Every run writes to a fresh timestamped folder, so no result is ever quietly replaced by a better one. That matters because the honest findings here are mostly negative: the clever sentiment rule lost to buying blindly, the timeframe edge was noise, and the composite ranking is a plateau rather than a peak. The one result that survived scrutiny — a slow crossover beating buy-and-hold on both return and drawdown — halved its own advantage the moment it was tested on a cycle it was not chosen on.